%201.svg)

.svg)
Note: Due to security classifications, specific unit details and detailed interface visuals cannot be disclosed. This case study focuses on design process, research methodology, collaboration, and measurable outcomes.
The Challenge
Space Force operations personnel based out of Schriever Space Force Base relied on fragmented digital systems causing inefficiency, inconsistency, and costly errors in mission-critical workflows.
My role at Silicon Mountain Technologies evolved through two distinct phases over 3 years:
Phase 1 (Feb 2022 - July 2023): Discovery Team
As part of a 3-person research team, I participated in discovery cycles identifying digital transformation opportunities across Space Force operations. Across 3 studies with 36-48 total interviews (2 on-site, 1 remote), I took detailed notes, observed user workflows, and progressively took on more responsibility—ultimately leading synthesis workshops and creating research frameworks that would prove essential.
Phase 2 (July 2023 - Oct 2024): Application Team
When I transitioned to sole UX designer on a product team, I applied these research methodologies to a failing application.
This case study focuses primarily on Phase 2, where discovery skills led to measurable impact: $1.2M+ cost savings, 30% error reduction, and 100+ hours saved quarterly for 500+ users.
What Users Were Facing
Users faced fragmented information across 12+ disparate systems requiring constant context-switching
Inconsistent UI patterns causing errors in high-stakes environments
Manual data entry and spreadsheet workflows creating bottlenecks and inefficiency
No centralized program visibility for leadership decision-making

Discovery & Research
Phase 1: Discovery Team (Feb 2022 - July 2023)
I joined SMT as a Junior Designer on a 3-person discovery-focused team. Our mission was to identify opportunities for digital transformation across Space Force operations—essentially asking "Where can we build digital tools to improve workflows?"
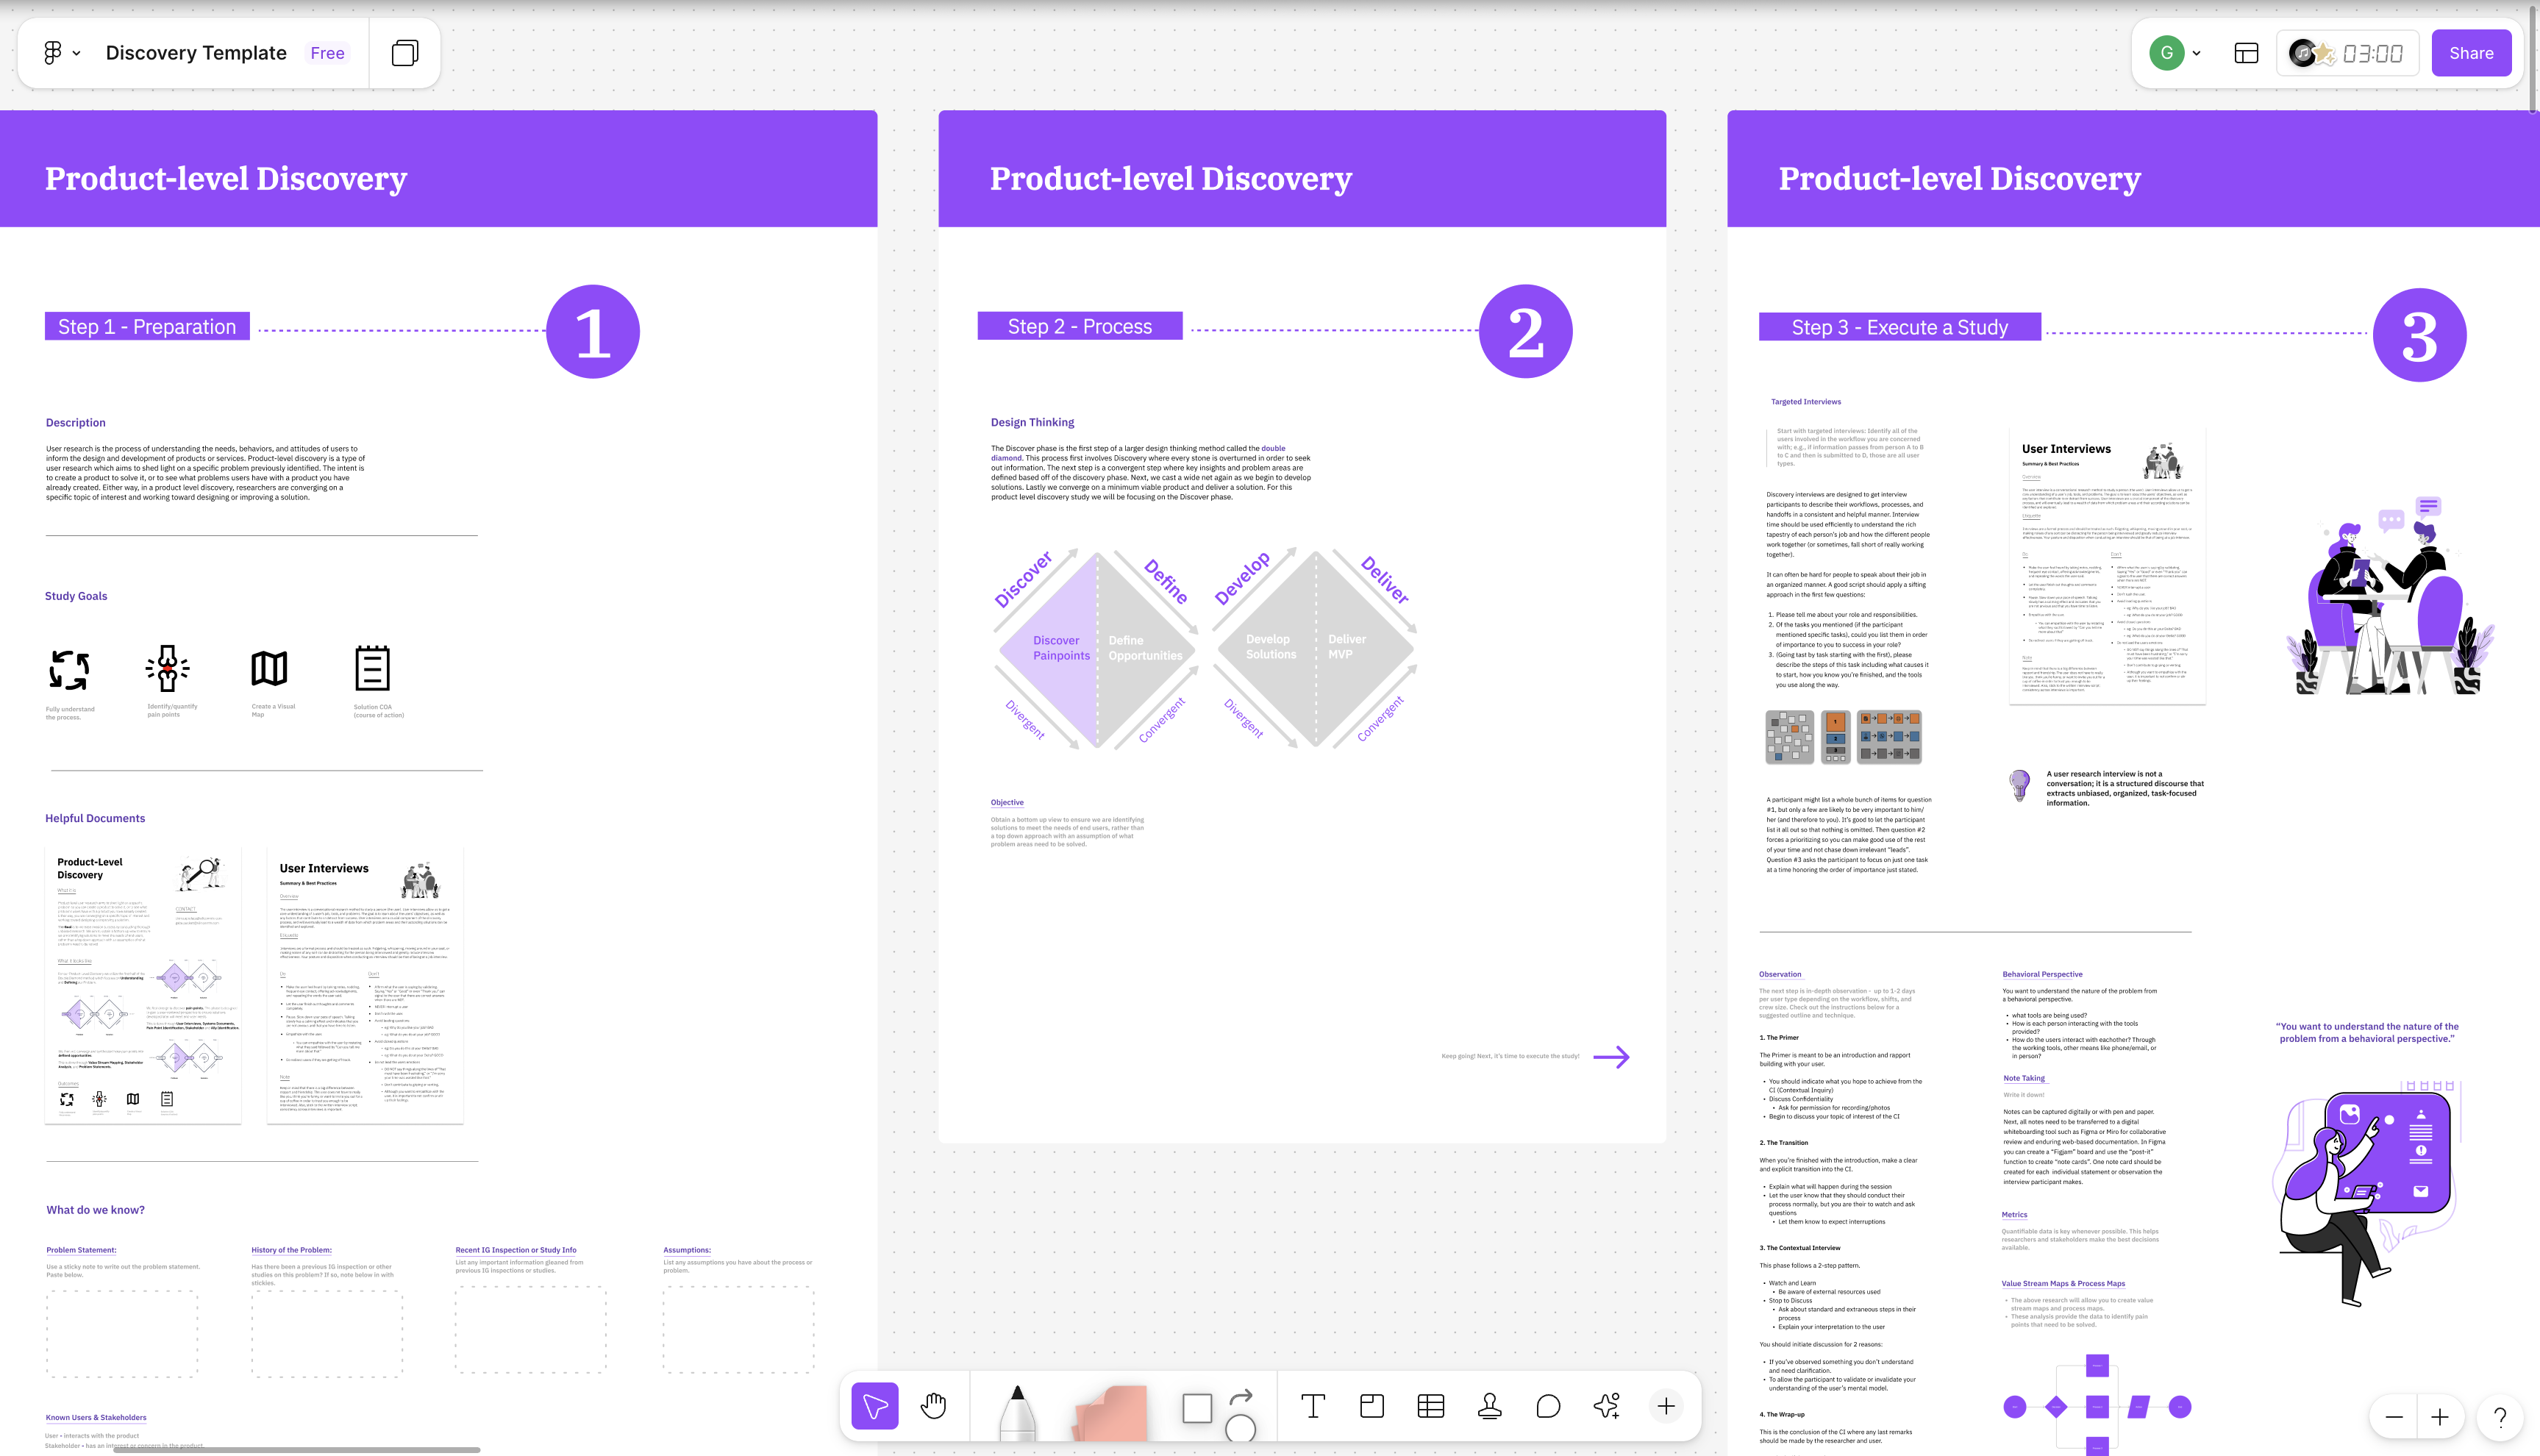
Discovery Templates & Frameworks - I created structured templates to guide research synthesis across our 3 discovery studies. These frameworks became team standards at SMT. When I transitioned to the application team in Phase 2, I used these same methods to identify the problems that led to the rollup dashboard. Above: Product-Level Discovery template showing a portion of the 6 -step process I designed in Figma.
Discovery Process: We conducted rapid discovery cycles—each following a structured weekly cadence:
Monday: In-brief with stakeholders to understand context and goals
Tuesday-Thursday: 12-18 interviews and observational studies per cycle
Friday: Out-brief presenting data informed key insights and problem areas to leadership
Over 17 months, I participated in 3 complete discovery cycles, conducting research across different Space Force teams to identify digital transformation opportunities.
My Evolution in Discovery
Cycles 1-2: Participated in on-site studies, note-taker during interviews, conducted observational research
Cycle 3: Planned study, conducted interviews, and led synthesis workshop
Throughout: Developed frameworks and templates that became company standards
Research Methods I Learned
Contextual inquiry and observational studies
Semi-structured user interviews
Stakeholder sessions with program leadership
Jobs-to-be-Done framework to uncover underlying needs
Synthesis and insight generation from qualitative data
Creating Systematic Research Frameworks
Through these discovery cycles, I recognized the need for repeatable processes. I created structured templates in FigJam that became our team's standard for research synthesis.
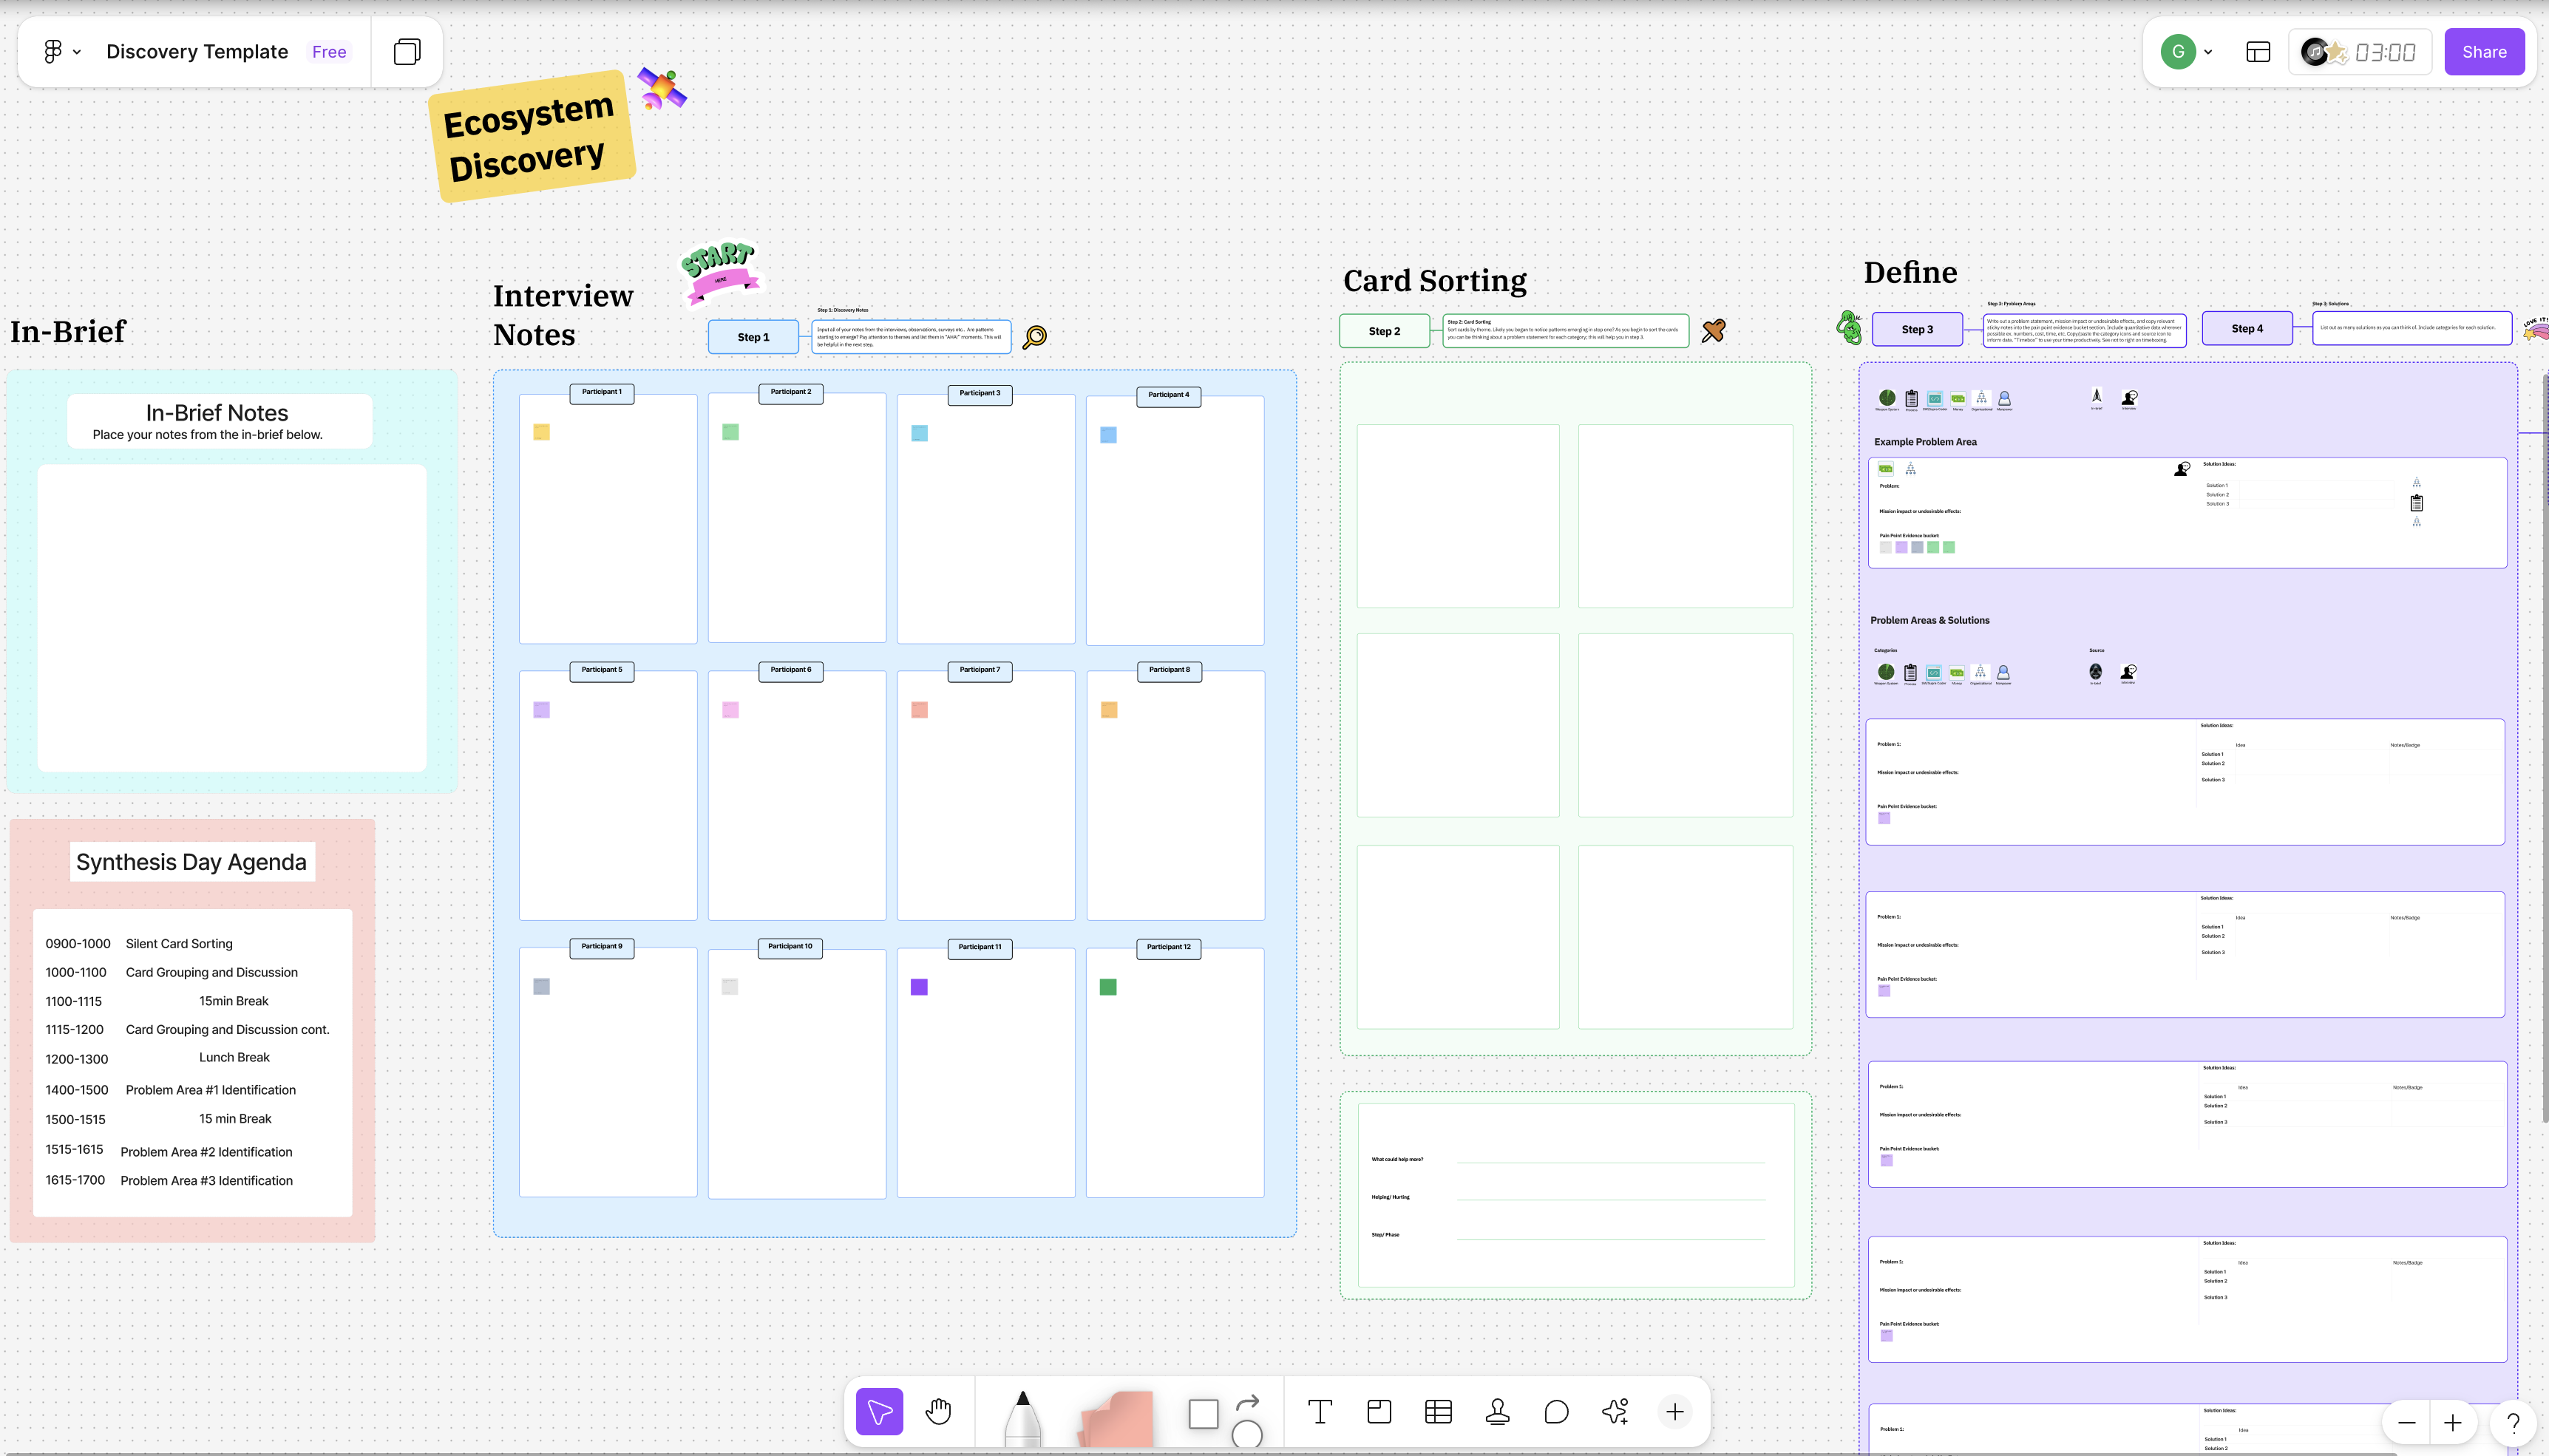
Ecosystem Discovery Template: For broader organizational studies, I developed this template combining in-brief notes, structured synthesis agenda, and collaborative problem identification. This approach helped identify system-wide opportunities across multiple Space Force teams and laid the groundwork for understanding the fragmented workflows that would later inform the rollup dashboard."
Framework Structure
Interview Notes - All team members added observations in real-time
Affinity Mapping - Grouped related findings into themes
Pattern Identification - Found recurring pain points across users
Key Insights - Distilled themes into actionable insights
Problem Prioritization - Ranked issues by impact and feasibility
This collaborative approach ensured engineers, PMs, and stakeholders developed shared understanding of user needs. More importantly, it gave me a systematic way to make sense of qualitative research—a skill that would prove essential when I became the sole designer on a product team.
What I Learned
Structured interview techniques
Collaborative synthesis methods
Creating frameworks others could follow
Presenting to government stakeholders
Translating user needs into opportunities
These 17 months on the discovery team were formative. I wasn't just conducting research—I was learning how to think systematically about user problems, how to facilitate cross-functional synthesis, and how to communicate findings to military leadership.
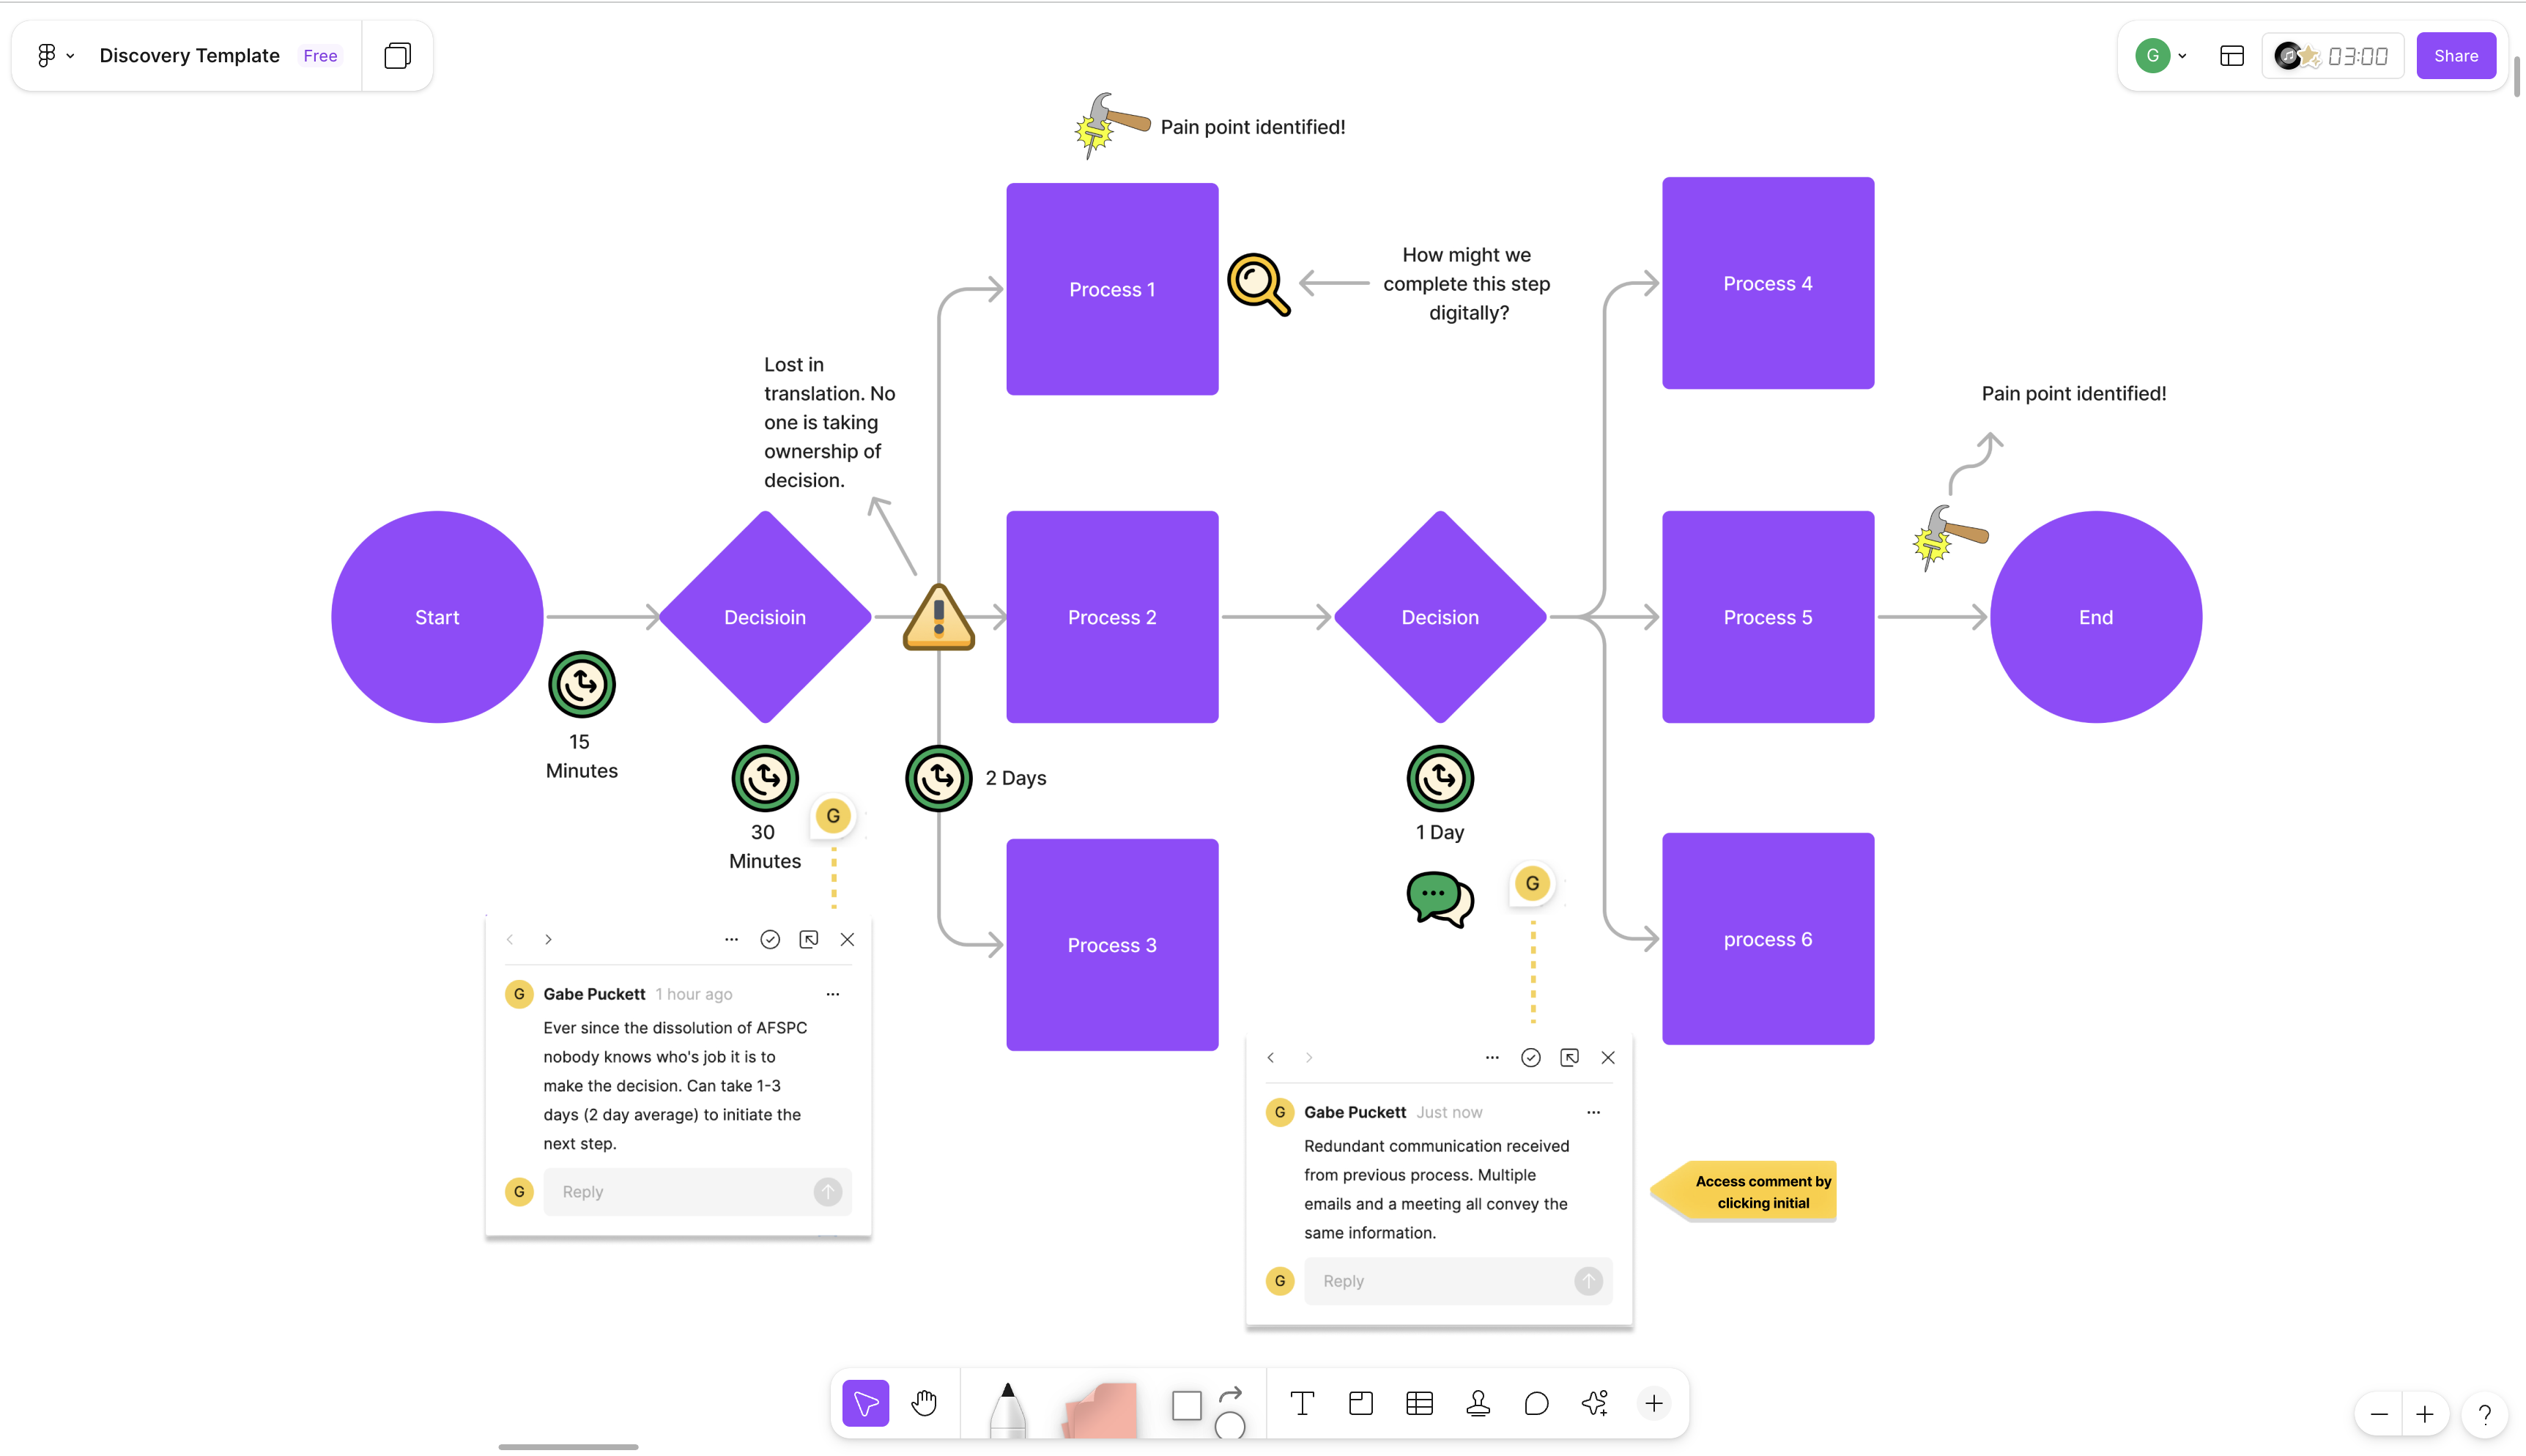
Collaborative Value Stream Mapping in FigJam: I taught team members to create value stream maps identifying pain points, delays, and opportunities across user workflows. This visual approach made complex operational challenges tangible and actionable, and became a key tool when analyzing the fragmented systems problem that led to the rollup dashboard.
The Transition
By July 2023, after participating in 3 discovery studies and leading synthesis for the final one, I had developed strong research capabilities and a portfolio of frameworks. When the opportunity came to join a product team as their sole UX designer, I was ready to apply these methodologies to a specific product challenge.
The application I was joining had a problem: it was receiving harsh feedback from users and stakeholders. Armed with the discovery skills I'd developed, I knew exactly where to start—with research.
Phase 2: Application Redesign - Applying Discovery Skills (July 2023 - Oct 2024)
When I transitioned to become the sole UX designer for a product team of 6 developers and 1 PM, the existing application was receiving harsh feedback. Users were frustrated, stakeholders were concerned, and the team needed direction.
I knew from my discovery experience that the first step wasn't designing—it was understanding why the application was failing.
Research Approach: I led a focused discovery initiative using the methodologies I'd developed:
12+ user interviews with Space Force personnel across different roles
Stakeholder sessions with government program leadership (who were also end users)
Pattern Identification found recurring pain points across users
Usability evaluation of existing application to identify friction points
JTBD study participation (led by PM, I co-facilitated interviews and synthesis)
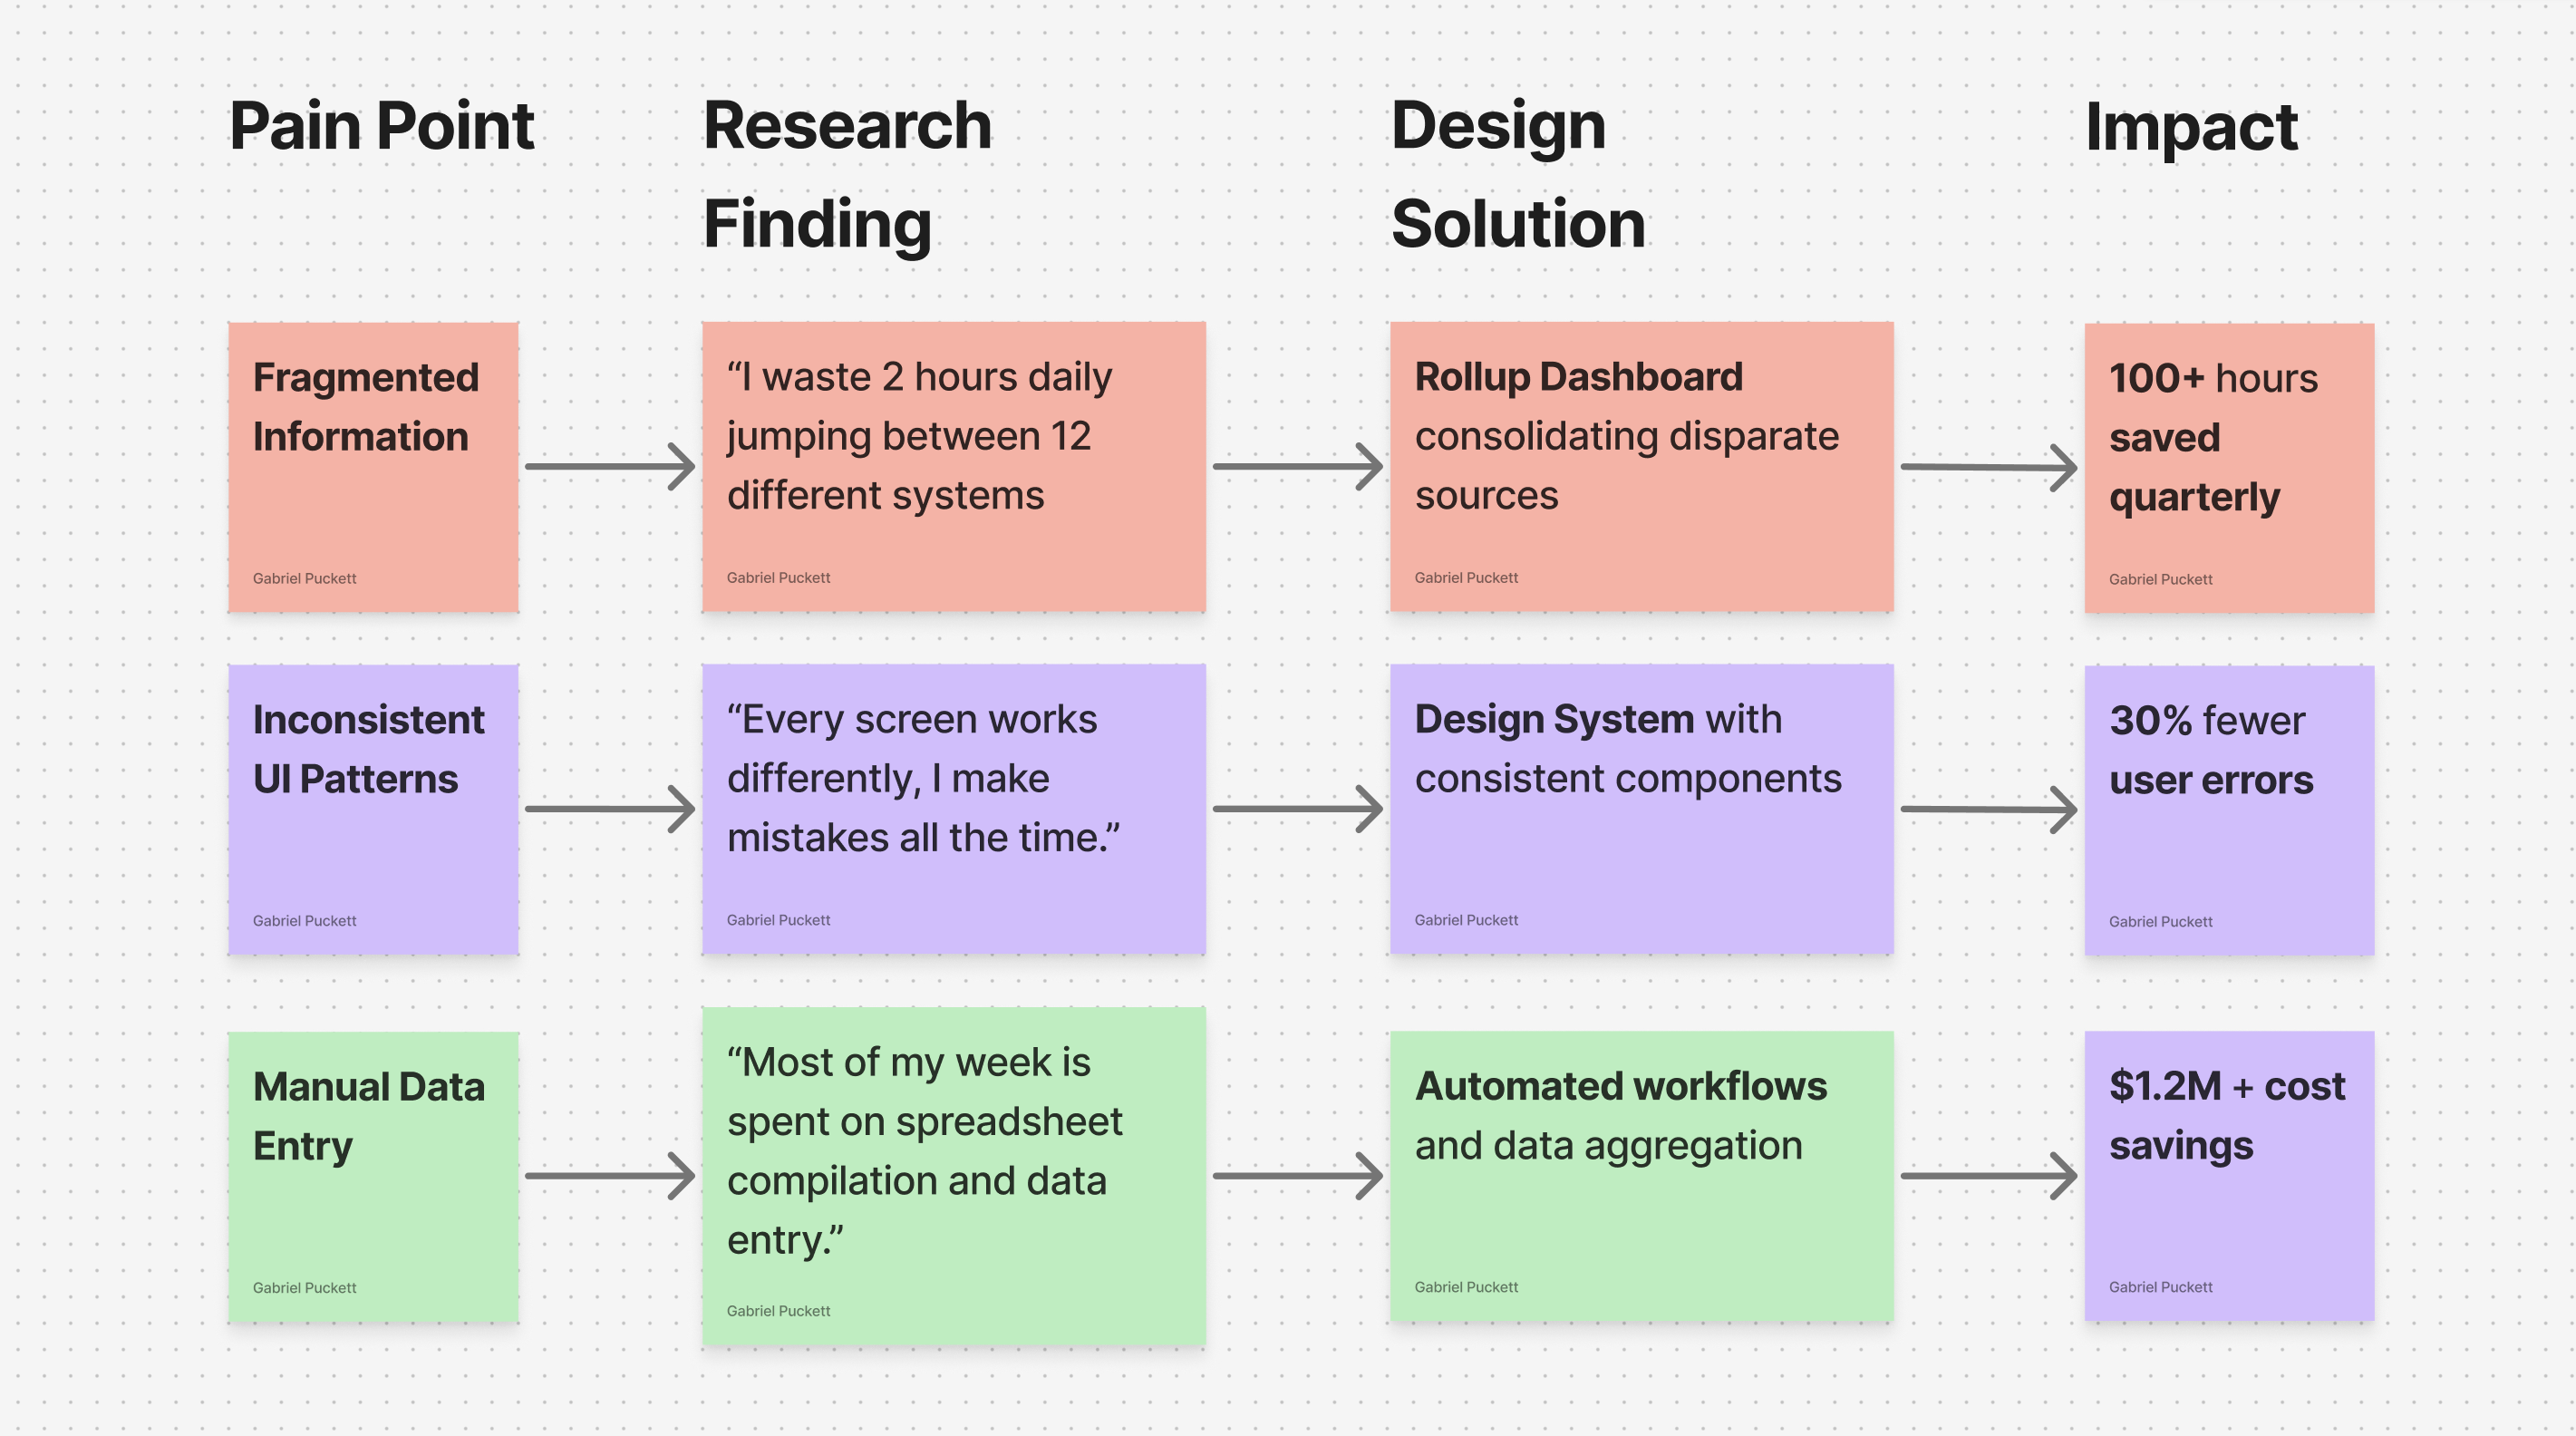
From Research to Impact - Three critical insights from discovery directly shaped our design direction and drove measurable business outcomes. The discovery methodologies I'd learned in Phase 1 enabled me to quickly identify and validate these problems.
Insight #1: Fragmented Information Architecture
"I waste 2 hours daily jumping between 12 different systems to get a complete picture of program status."
Users were context-switching constantly, manually compiling data from multiple sources. This wasn't just inefficient—it was error-prone and delayed critical decision-making.
Design Response: Created the "Rollup Dashboard" consolidating disparate views into unified interface
Insight #2: Inconsistent UI Patterns Causing Errors
The application had some existing screens, but no formal design system. Every section worked differently. Users struggled with inconsistent interactions, leading to costly mistakes in high-stakes environments where errors had serious consequences.
Design Response: Built formal design system with consistent component patterns
Insight #3: Manual Data Entry Creating Bottlenecks
Users spent hours manually entering data that existed elsewhere in other systems. This created inefficiency, consumed 100+ staff hours quarterly, and introduced error potential.
Design Response: Automated data aggregation and streamlined workflows
These insights didn't come from guessing—they came from applying the systematic research approach I'd developed over 17 months on the discovery team. The frameworks I'd created helped me quickly synthesize findings and identify the highest-impact problems to solve.
The Rollup Dashboard Solution
Leadership and operations personnel needed to monitor multiple programs simultaneously but had to manually check 12+ different data sources, compile spreadsheets, and create custom reports. This consumed 100+ staff hours weekly and delayed critical decision-making.
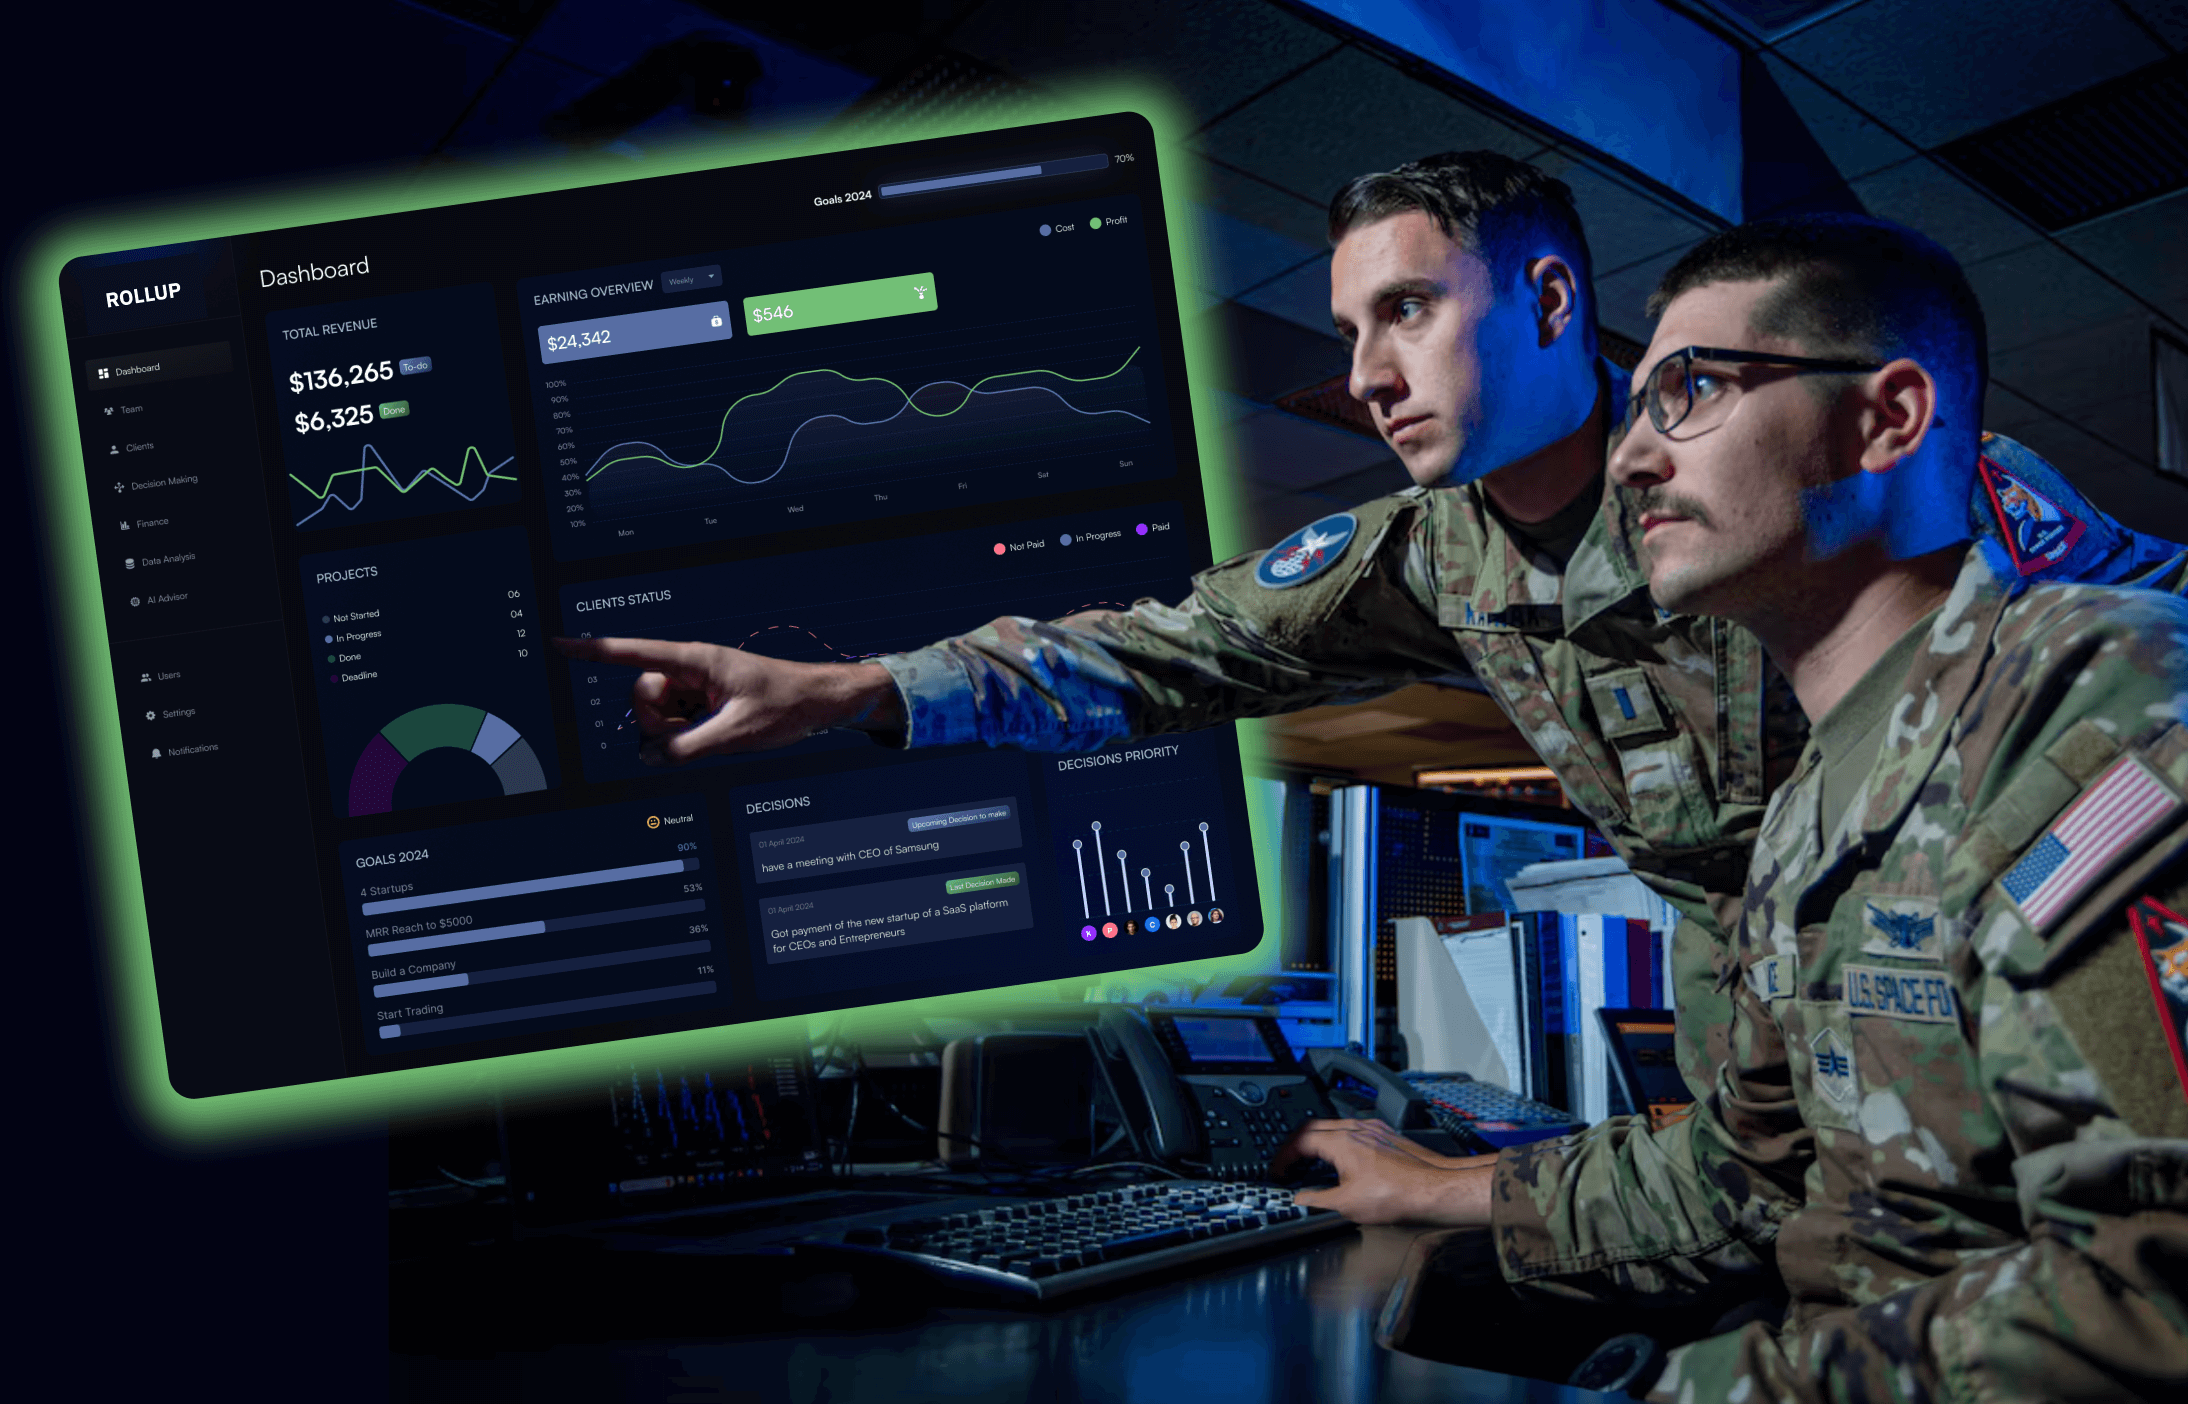
Note: Mockup created for portfolio - actual dashboard interface contains CUI (Controlled Unclassified Information) and cannot be displayed
From Fragmentation to Unity - Before the rollup, users manually checked 12+ systems daily. After, all critical program data was consolidated into a single, real-time dashboard with customizable views.
Design Process
High-Fidelity Prototyping: I created interactive prototypes exploring different approaches to data aggregation:
View hierarchy: Program-level overview → drill-down to details
Data visualization: Testing different chart types for different metrics
Filtering & sorting: Enabling users to customize their view
Collaboration features: Sharing rollups and maintaining edit history
Iterative Usability Testing: I conducted multiple rounds of testing with users to refine:
Which metrics to display at each hierarchy level
How to visualize complex program relationships
What filtering options provided most value
How to best integrate collaborators and different views for different roles
The Final Rollup
Consolidated 12+ data sources into single unified dashboard
Customizable views allowing users to focus on relevant programs
Real-time updates eliminating manual data compilation
Risk visualization highlighting programs needing attention
Timeline views showing program schedules and dependencies
Collaboration tools for sharing insights with stakeholders
Building the Design System
The application had no formal design system—just inconsistent screens confusing users and slowing our 6-developer team. As the sole designer, I needed to create a system that could scale beyond my direct involvement.
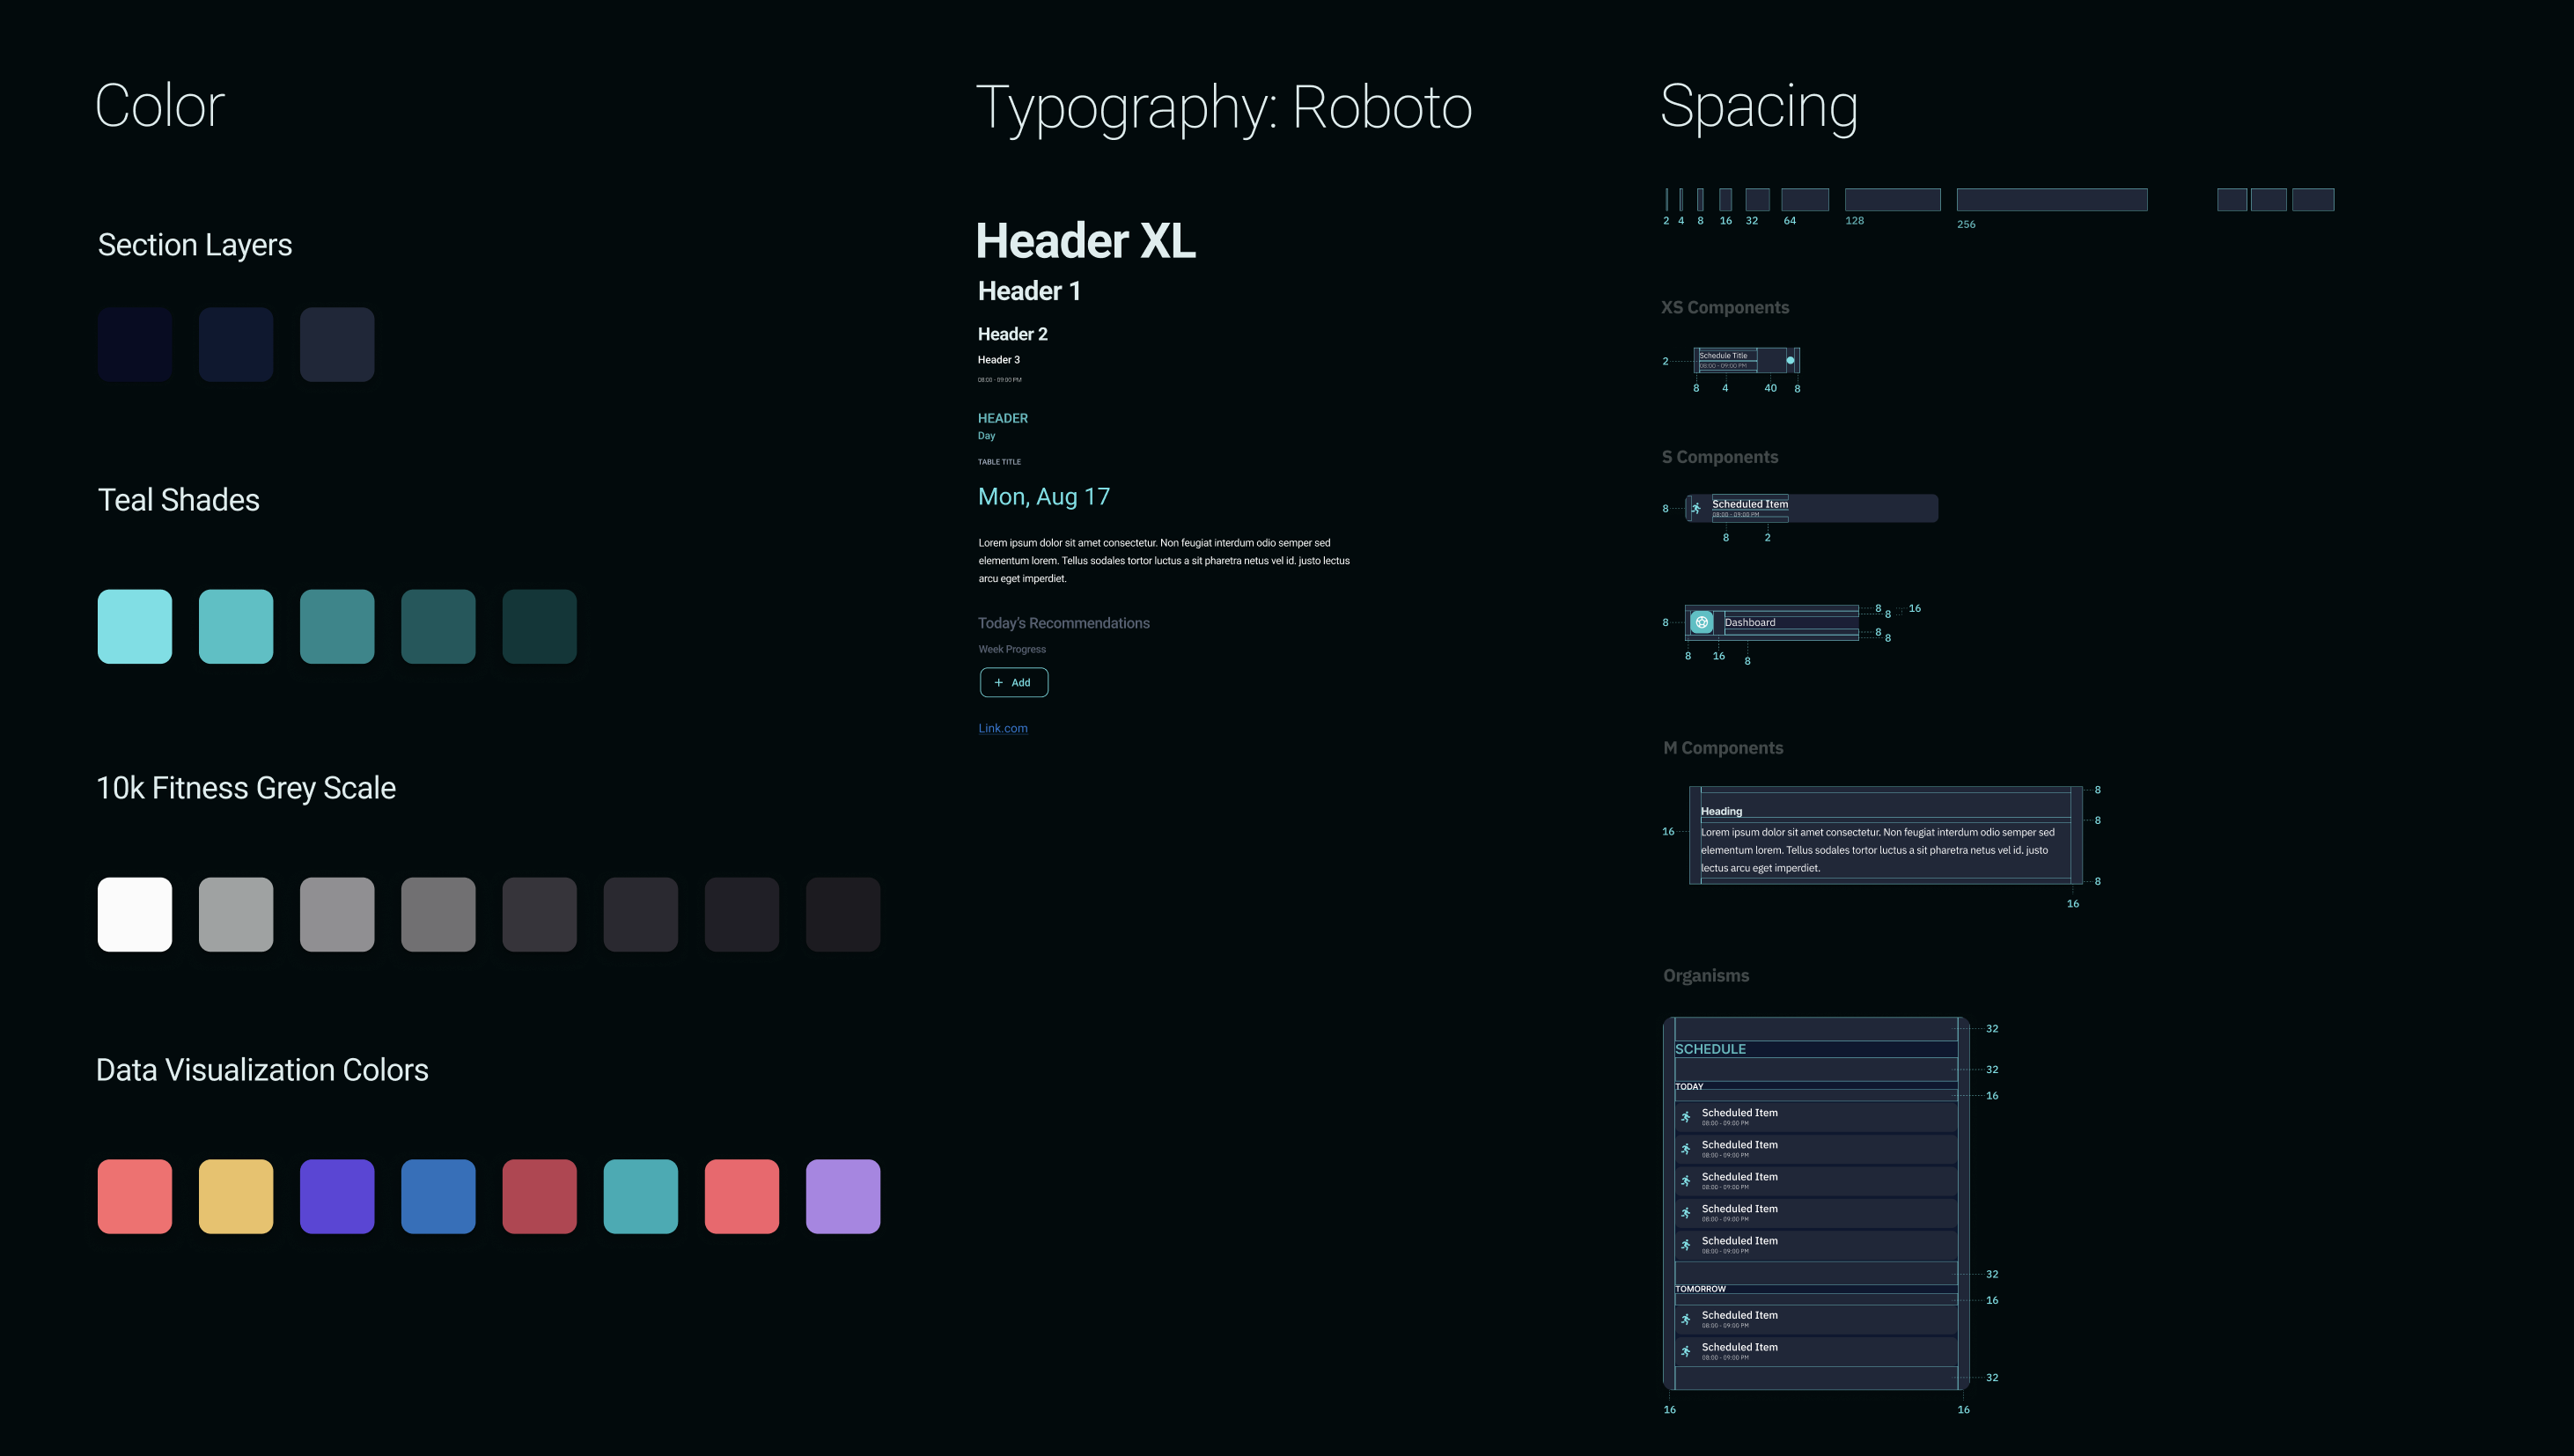
Note: Due to security reasons the above image does not reflect the actual design system of the product
What I built
40-50 components organized in atomic design methodology
Foundation layer: color system, typography, spacing grid, iconography
Comprehensive documentation with usage guidelines
Component library enabling developers to implement designs independently
Teaching the System
.png)
UX 101: Fundamentals Course - The image above is a segment from the lesson "Grids & Structure" which I created as part of the course
Working with Space Force developers who had limited UX training, I created UX 101: Fundamentals — a comprehensive course covering design thinking, research methods, visual design, and system implementation.
Impact: 6 people trained (4 Space Force developers + 2 teammates). Developers could implement designs independently using the system, maintaining quality even when I wasn't directly involved.
User-centered design principles and research methodology
Usability testing and accessibility requirements
Design system implementation and component usage
Visual design fundamentals (color theory, typography, grids)
Impact & Outcomes
Buisness Results
$1.2M+ in Annual Cost Savings: Eliminated manual data compilation, reduced context-switching time, and streamlined workflows for 500+ Space Force personnel by consolidating 15+ disparate data sources.
100+ Staff Hours Saved Weekly: The rollup dashboard automated manual data gathering, giving leadership instant access to program status and reducing report creation time.
30% Reduction in User Errors: Design system created consistent interaction patterns, improved visual hierarchy, and better error prevention—validated through usability testing.

Design System Impact
Scalable component library enabling faster feature development
Consistent implementation across the application
Empowered developers to work independently
Elevated design maturity across the organization
Career Growth
Promoted from Junior to Mid-Level Designer (November 2024) — recognized for leading UX research initiatives, driving measurable business impact, and establishing design authority within cross-functional teams.
Closing
What I Learned
This project showed me that research skills aren't separate from design skills—they're foundational to it. The 17 months I spent learning systematic research methods directly enabled my success as a sole designer.
Phase 1: Learn research methodology through 3 discovery studies
Phase 2: Apply those methods to identify high-impact problems
Result: Design solutions driving $1.2M+ in measurable value
Working on classified defense systems taught me that clarity isn't just aesthetics—it's mission success. I learned to explain design value through outcomes: "Here's the research showing this costs 100+ hours weekly, here's how this design solves it, here's how we'll measure success."
That discipline—connecting design decisions to business outcomes—became my signature approach, and it's what I'm bringing to my next role designing products at scale.
See More Projects
Select work that showcases a variety of design direction and skill.
%20(1).png)
%20(1).png)
%20(1).png)
%201%20(1)%20(1).png)
Homies
A complete digital toolkit for hosts that spans branding, booking sites, and conversion-focused design.
View